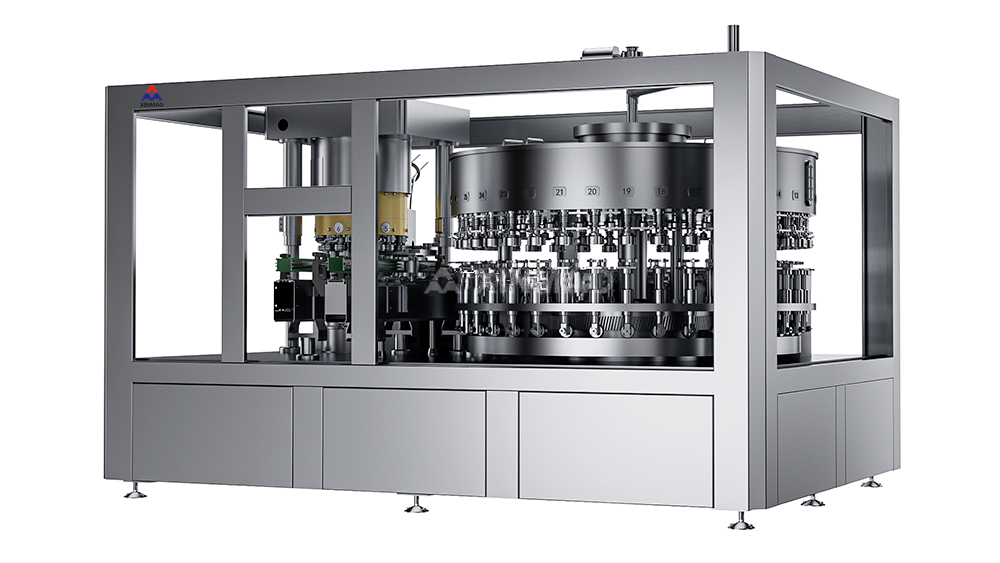
Upfront Investment: Capital Costs of Aluminum vs. PET Can Filling Machines
Capital expenditure sets the ROI clock. A 2026 filling system analysis reports that a 150-container-per-minute rotary aluminum can filling machine averages $385,000, while a comparable linear PET can filling system averages $260,000. Aluminum systems carry an 18–35% initial cost premium due to advanced pressure controls, integrated seamers, and rigid-can handling requirements.
| Cost factor | Aluminum can filling machine | PET can filling machine |
|---|---|---|
| Base equipment cost | $280k–$420k | $190k–$310k |
| Ancillary systems (rinsers, CO₂ recovery) | +$65k | +$40k |
| Installation and calibration | 120–160 labor hours | 80–120 labor hours |
| Total installed equipment range | $345k–$485k | $230k–$350k |
A mid-size beverage line may spend roughly $125,000 more on base aluminum equipment—and invest an additional 40 labor hours in installation—compared to PET. Total installed cost for aluminum can reach $485,000; PET typically stays below $350,000 before utilities, conveyors, or site prep. These gaps shift with filler speed, automation level, and whether the line uses pre-made containers or blow-fill-cap monoblocs.
For startups, PET’s lower entry cost can accelerate time-to-first-production and reduce initial debt service. Yet capex alone is insufficient: scrap rates, seamer maintenance frequency, and container supply stability must also be weighed. A lower purchase price doesn’t guarantee faster ROI if material waste or unplanned downtime rises post-installation. Financing terms and local labor rates can widen or narrow the upfront gap by 5–10%.
Operational Performance: Throughput, Flexibility, and Uptime of Can Filling Machines
Operational performance determines whether a packaging line delivers consistent output—or becomes a bottleneck. For aluminum and PET can filling machines, throughput, format flexibility, and uptime directly influence labor allocation, line utilization, and payback timing. A well-balanced filler-seamer pair avoids backlog and sustains target output. Industry benchmark data from 2026 show high-speed rotary fillers for rigid aluminum cans often achieve 1,200–2,000 cans per minute, while flexible multi-format lines run at 300–600 cans per minute depending on viscosity and carbonation level.
Line Speed and Format Change Efficiency for Beverage Production
Line speed isn’t static—it responds to container material, fill volume, and product type. Aluminum’s stable sidewalls support aggressive conveyor speeds and high fill rates. PET’s lighter, more compressible structure requires controlled handling and may run 5–15% slower on comparable filler-seamer configurations (2026 packaging industry benchmark). Servo-driven fillers with automatic recipe management are narrowing that gap.
Format change efficiency is equally decisive: quick-change rails, snap-in fill valves, and tool-less starwheel adjustments can cut changeover from 30–45 minutes to under 10 minutes. This agility allows producers to switch between aluminum and PET packaging—or among multiple can sizes—without sacrificing uptime. Plants prioritizing short changeovers and balanced filler-seamer timing typically achieve overall equipment effectiveness (OEE) 5–10 percentage points higher than less flexible lines.
Total Cost of Ownership for Can Filling Machines: Maintenance, Energy, and Labor
Initial purchase price is only one piece of the ROI equation. For can filling machines, energy, maintenance, and direct labor dominate long-term costs. Modern high-speed systems draw 60–170 kW depending on capacity; at typical industrial electricity rates, annual energy use can approach $23,000. Energy demand correlates more strongly with line speed and automation level than container material—so local utility rates and shift patterns should anchor comparisons. Labor cost varies significantly with automation: highly automated lines may need just 1–2 operators per shift, while semi-automated systems often require 3–4. This labor differential is frequently the largest controllable cost—and can easily offset a lower capital price.
Material-Specific Wear Patterns and Preventive Maintenance Schedules
Aluminum and PET containers drive distinct wear patterns and maintenance priorities. Aluminum systems concentrate wear in high-pressure fill valves and seaming stations—valves alone account for nearly two-thirds of repair bills, according to maintenance records. PET lines see more frequent closure-head drift and seal wear, as plastic surfaces shift under pressure and retain less heat during sealing. A generic maintenance schedule risks over-servicing one area while neglecting another—increasing repair costs and slowing changeovers.
| Component / area | Aluminum can filling machine | PET can filling machine | Preventive action |
|---|---|---|---|
| Fill valves | High wear from carbonation pressure | Moderate to low wear | Inspect and rebuild valves every 2,000 hours |
| Sealing / seaming station | Seamer wear from metal lids | Capping-head drift and seal wear | Calibrate torque or pressure weekly |
| Conveyor / guides | Light metal dust buildup | Plastic dust and static buildup | Clean guides and sensors per shift |
Automated lubrication systems can reduce maintenance labor across both platforms, delivering reported savings of $2,000–$4,000 per quarter. A material-specific preventive maintenance schedule helps avoid unplanned downtime—and protects long-term ROI.
ROI Comparison: Payback Period Modeling for Aluminum and PET Can Filling Machines
Payback period measures how many months or years a beverage operation needs to recover its total investment in a can filling machine. It’s calculated as total investment divided by net annual benefit. For example, a $120,000 system generating $95,000 annually in labor savings, scrap reduction, and incremental margin reaches payback in about 1.26 years. In packaging, a payback of one to three years is generally strong—but the right benchmark depends on production scale, margins, and growth trajectory. Relying solely on payback can mislead: a slightly longer payback paired with higher lifetime ROI may deliver greater total value.
Real-World ROI Scenarios Across Production Volumes and Beverage Types
Production volume and beverage type meaningfully shift payback outcomes. The table below illustrates modeling scenarios based on line capacity, assuming consistent local material prices, labor costs, and selling price.
| Line Capacity | Annual Can Output Assumption | Project Investment | Annual Net Profit | Estimated ROI | Payback Period |
|---|---|---|---|---|---|
| 3,000 BPH | 6.12 million cans | $450,000 | $190,000 | 42.2% | 2.37 years |
| 6,000 BPH | 12.24 million cans | $800,000 | $545,600 | 68.2% | 1.47 years |
| 12,000 BPH | 24.48 million cans | $1,500,000 | $1,050,000 | 70.0% | 1.43 years |
Carbonated beverages often require higher-pressure components and more frequent format changes than still water or juice—extending downtime and delaying payback. Aluminum lines benefit from lighter container weight and faster line speeds; PET lines may consume more energy in preform handling but offer long-term lightweighting advantages. Modeling gains separately—labor reduction, scrap savings, and increased sellable output—helps validate assumptions before purchase. Applying a conservative residual value over a defined asset life ensures accurate ROI and payback comparisons between aluminum and PET can filling machines—not just upfront price.
FAQs
What is the main cost difference between aluminum and PET can filling machines?
Aluminum can filling machines are typically 18–35% more expensive upfront compared to PET machines due to features like advanced pressure controls and integrated seamers.
How does container material impact operational performance?
Aluminum supports higher conveyor speeds and fill rates due to its stable sidewalls, while PET requires controlled handling, running 5–15% slower on average.
What are the key factors influencing the total cost of ownership?
Energy consumption, maintenance, and labor costs are the primary factors. Automation level and local utility rates also play a significant role.
How do aluminum and PET machines differ in maintenance needs?
Aluminum machines see higher wear on fill valves and seaming stations, whereas PET machines experience more issues with closure-head seals and drift.
What is a typical payback period for can filling machines?
Payback ranges from 1 to 3 years based on production scale, margins, and machine features. Aluminum machines may achieve faster ROI with higher volume operations.
Table of Contents
- Upfront Investment: Capital Costs of Aluminum vs. PET Can Filling Machines
- Operational Performance: Throughput, Flexibility, and Uptime of Can Filling Machines
- Total Cost of Ownership for Can Filling Machines: Maintenance, Energy, and Labor
- ROI Comparison: Payback Period Modeling for Aluminum and PET Can Filling Machines
- FAQs